Reports
Decisions, not data dumps.
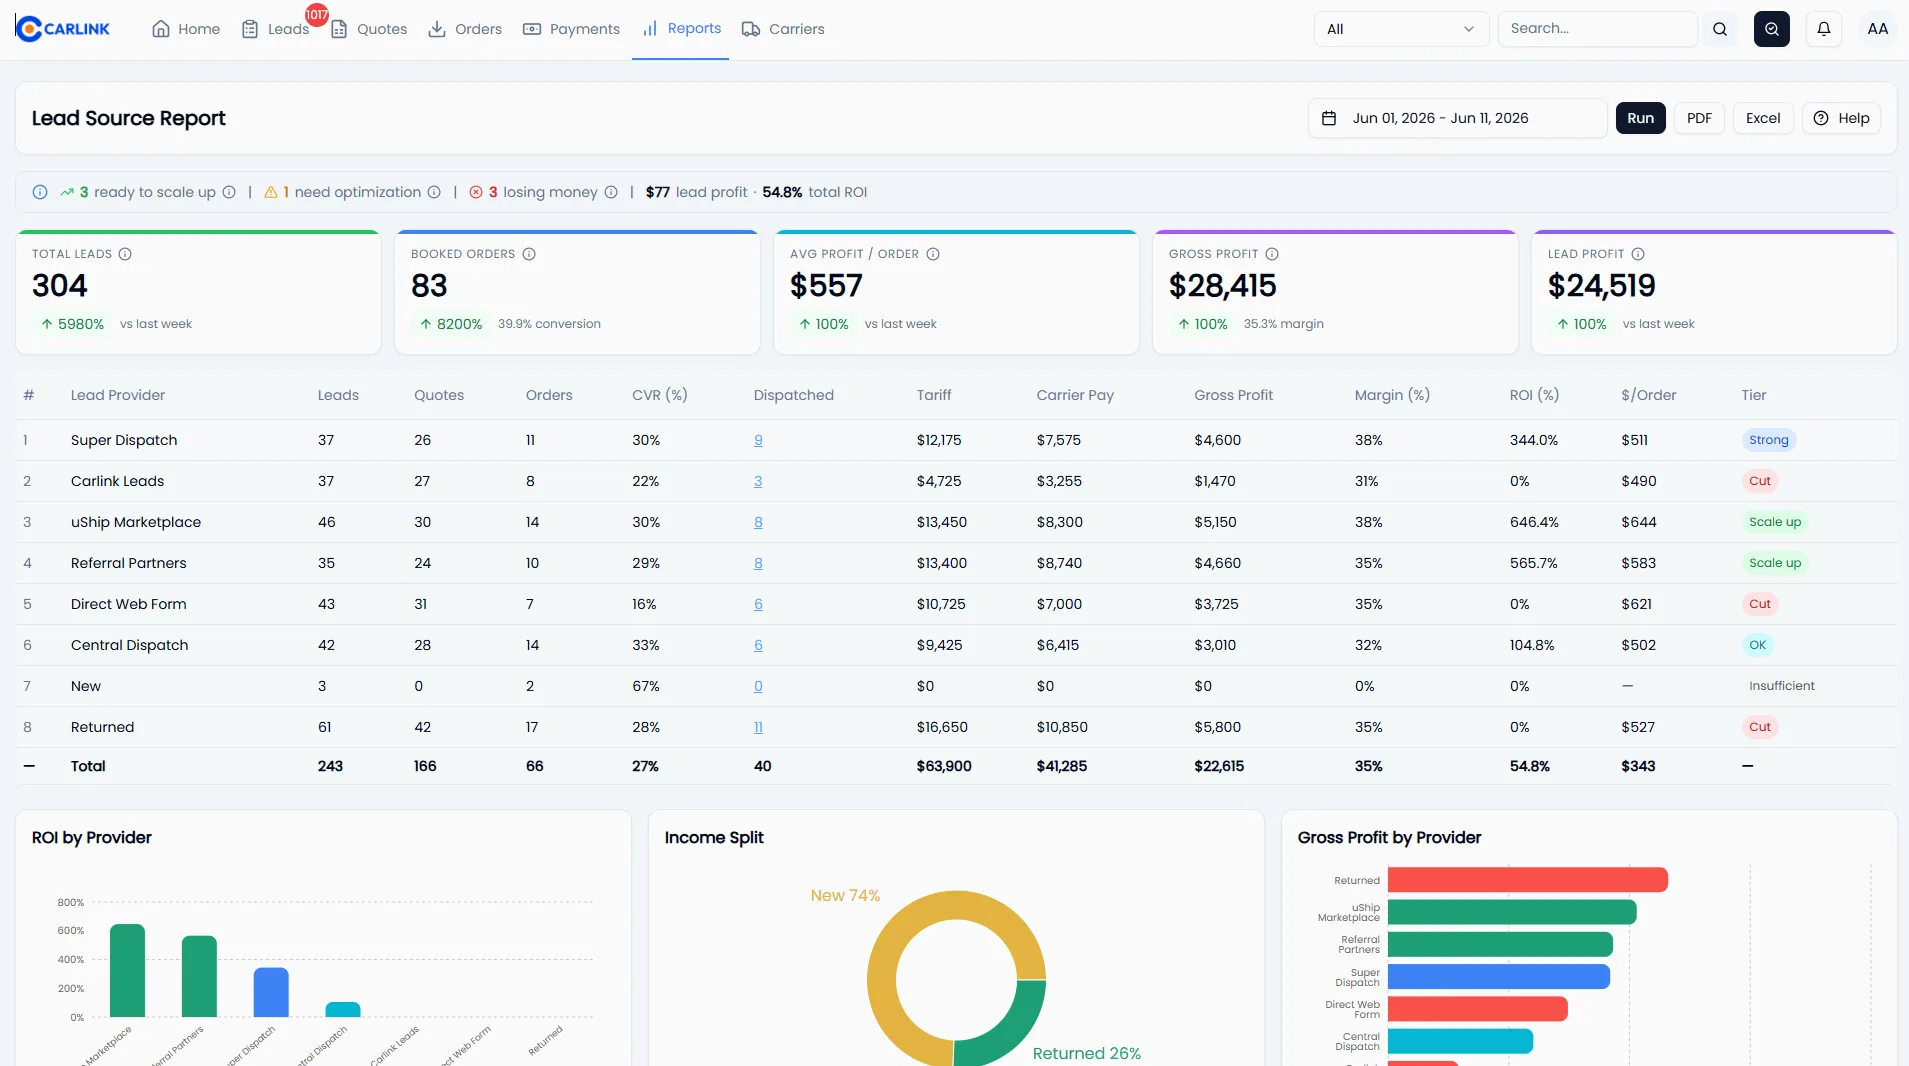
Every signal that matters — live. No spreadsheet exports, no month-end reconstruction.
Brokerage owners spend hours every week reading eight different reports to figure out if last month was good. By the time the picture is clear, it's already next month — and the leads that killed the margin are gone. Decisions get made on stale data.
Carlink rolls every signal that matters — lead-source ROI, per-agent profitability, per-company margin, daily dispatched count — into a single dashboard. Every order updates the picture. No 'Generate Report' button, no CSV exports, no waiting. Your books are always live.
What you actually get.
Everything Reports ships with.
Concrete capabilities you can verify with your own data on day one.
- 3 main report types: Lead Source ROI · Agent Performance · Company P&L
- Filters: company, agent, source, date range (today, MTD, YTD, custom)
- ROI tier badges: Dead / Low / Moderate / High — update live as orders close
- Per-agent leaderboard with leads, dispatched, gross profit, commission
- Multi-company workspace (separate books, one login)
- CSV export anytime for your accountant
- 6 brokerages, 68 agents tracked in real time today
- $48.9M+ freight orchestrated visible across all reports
Three steps. That's it.
Configure commission tiers
Set the % per dispatched-count bucket once (e.g., 10% under 25 loads/mo, 20% under 35, 25% under 60, 32% above). Carlink applies the rule to every order from then on.
Carlink computes margins from order data
Tariff, carrier pay, lead expense, other expense — all roll up into gross profit and margin per order. No manual P&L reconstruction. No spreadsheet imports.
Open the dashboard anytime
Slice by company, agent, source, period. Compare months. Drill into any number to see the underlying orders. Export to CSV when accounting asks.
How a typical day looks.
It's Sunday night, 9 PM. The owner opens Carlink on their phone. April so far: $238K freight, $46K gross profit, 19% margin. L6 is High ROI ($212/order, 27% margin). zzz is Dead (zero closes from 47 leads). Jeff is the top agent with $30K in agent profit — about to break the 32% commission tier. Decision made before bed: pause zzz, double L6 spend, and tell Jeff he's being promoted Monday. No CSV exports, no spreadsheet — five minutes from open to action.
// Pulled from the brokerages running on Carlink today
See the rest of the platform.
Reports, answered.
Go deeper on reports.

How Much Do Auto Transport Brokers Make?
What auto transport brokers really earn: broker income is margin per load times loads booked, minus cost. Real per-load margins, monthly income scenarios from solo broker to growing brokerage, and the levers that decide your take-home.

Best Auto Transport Software for Brokers (2026 Buyer's Guide)
Choosing auto transport software? A practical buyer's guide: loadboard vs CRM vs an all-in-one brokerage platform, the six must-have features to look for, how to run a demo that tells the truth, and what it should cost.
Why Spreadsheets Are Killing Your Auto Transport Brokerage
Excel and Google Sheets feel free — but they quietly leak money at every step of a brokerage: lost leads, slow quotes, double-bookings, missed carrier payments, and decisions made on stale data. Here's the real cost, and when to switch.
See Reports with your own data.
30-minute demo. Walked through by an operator.